Managing Analytics in Percussion CMS
Percussion CMS provides a variety of Analytics capabilities from the Dashboard. Percussion provides a few native capabilities, but then also integrates with Google Analytics for more advanced analytic capabilities. To take advantage of the Google Analytics driven gadgets you must first configure the Google Analytics integration.
Viewing Publishing Activity
The Activity gadget enables users to view page editing and publishing activity summary metrics for a specified period of time. Page activity includes the number of pages added, updated, and removed from the site(s). The gadget also shows the number of pages on the site and the number of pages ready to be published. By default, the gadget shows activity for all sites in the last five days, but you can change the settings to display a custom time frame.
The following metrics are displayed:
- # Pages on Site - The total number of pages published on the site.
- Changes - The number of page changes during the time span shown. Changes is the sum of the columns New, Updates, and Take Downs.
- New - The number of pages that went live for the first time during the time span shown.
- Updates - The number of pages that were previously live that became live again during the time span. For example, a published event page is taken down and modified before or during the time span, but made live again during the time span.
- Take downs - Number of pages removed from the published site during the time span shown.
- Pending - All pages that are in a pending at the time that activity is being calculated.

Viewing Traffic Analytics
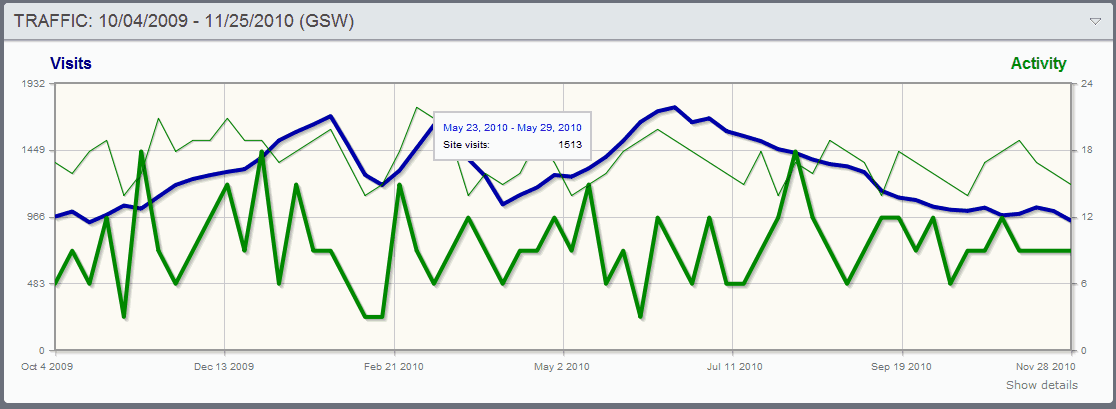
The Traffic gadget helps you assess the effectiveness of the work you do on your site by overlaying a graph of site visits on a graph of site changes (new pages, changed pages, and removed pages). To use this gadget for a site, you must assign a Google Analytics profile to the site.

The horizontal scale (x-axis) displays the date range.
The left vertical scale displays the range of site visits. Site visits are derived from Google Analytics data and are graphed using a thick dark blue line.
The right vertical scale (x-axis) displays the range of site changes. Site updates and live pages are graphed against this scale
- Updates are graphed as a thick green line. Updates can include new pages, modified pages, and removed pages. The gadget configuration defines which changes are included in the graph.
- Live pages are graphed as a thin green line.
Hovering over the data points displays a tooltip with the date and additional data:
- When hovering over dates on the site visits graph (thick dark blue line) the tooltip includes page views or unique page views, as specified in the configuration of the gadget.
- When hovering over dates on the updates graph (thick green line), the tooltip includes new pages, modified pages, or removed pages, as defined in the gadget configuration.
- When hovering over dates on the live pages graph (thin green line), the tooltip includes the total live pages on the site.
Examining Traffic Details
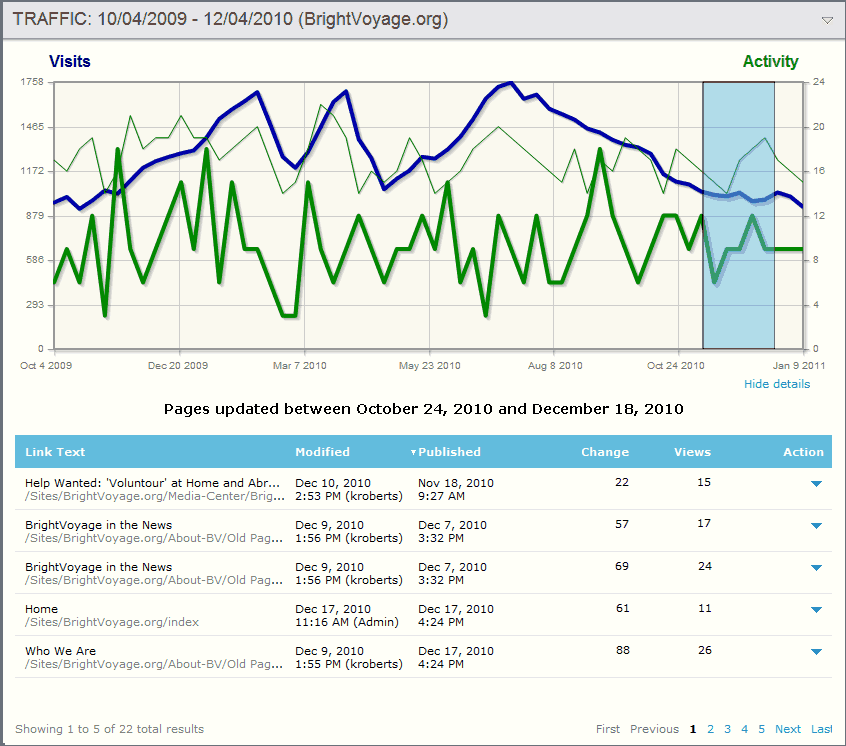
To view details about traffic data, click on a date and drag to select the date range for which you want to see detailed data. Detailed data for the date range you selected is displayed in a table below the graph.

For each page, you can view the change in the number of visits over the previous period of the same length as the selected range. For example, if you selected a range of October 8 to October 15 (seven days), the value in the Change column would be the change in number of visits during the previous seven days (October 1 to October 7). You can also see the number of times the page was viewed during the detailed date range. This may be total views or unique views depending on the configuration of the widget.
Viewing Traffic Changes by Site and Section
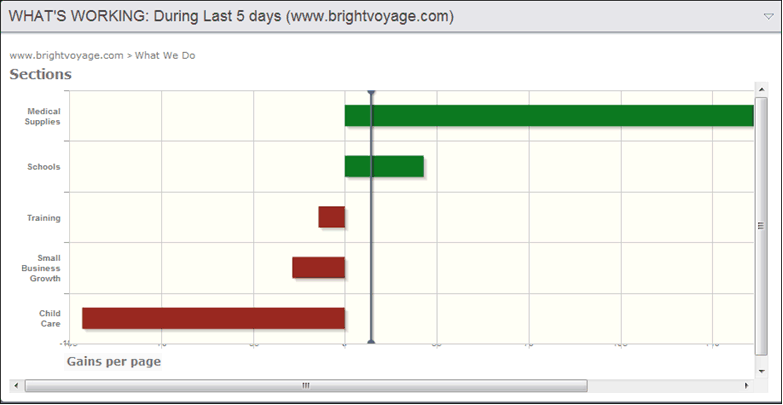
The What's Working gadget computes the effectiveness of changes to pages on a specified area of a site by calculating the change in number of views per page change (gains per page) in that area of the site for a specified period of time. To view the sub-sections and folders of a parent section, you must click on the bar on the graph representing the parent section or folder. You can continue to see the effectiveness of changes to more deeply embedded sub-sections and sub-folders in a site by clicking on lower level bars until you have reached a path's lowest level.

The gadget's y-axis lists the sites or sections evaluated. Each site or section is represented by a horizontal bar which indicates the actual gain. The goal (minimum acceptable views) is represented by a gray vertical line. If a site or section bar reaches the goal or extends beyond it, it is green, which indicates that the changes have worked. If a site or section bar does not reach the goal, it is red, which indicates that the changes have not worked.
Configuration Options
To configure the time range to display, you must configure both the Duration and the How Many fields.
To set the threshold for the red and green bars, you set the Goal field. By default, this is 0, meaning that any increase is views will be displayed as positive.
??
You can also decide on the method for counting number of pages viewed during a session. Options are:
- Page views (default) - A page is counted each time it is hit during a session.
- Unique page views - A page is counted once during a session regardless of the number of times it is hit.
Duration - The unit for measuring the time range of the data shown on the gadget. Options are:
- Days (default)
- Weeks
- Months (units of 30 days)
- Years
How Many - A number indicating how many Duration units are included when calculating pages. Any integer greater than 0 is valid. Default is 0.
